This has been the craziest year for stock market. Since the beginning of the year, Global economy showed slowdown in every sector. Macro fears has been maximum, but fear index volatility Vix is down near 52 weak low. Every bad news sounds as if there could be another Lehman like event.
This is election year, so expect equity to be positive for the first half. Once election is over, S&P500 will turn negative for the year.
Table Below Shows Market Returns for Each Election Year Since 1928
| S&P 500 Stock Market Returns During Election Years | ||
| Year | Return | Candidates |
| 1928 | 43.6% | Hoover vs. Smith |
| 1932 | -8.2% | Roosevelt vs. Hoover |
| 1936 | 33.9% | Roosevelt vs. Landon |
| 1940 | -9.8% | Roosevelt vs. Willkie |
| 1944 | 19.7% | Roosevelt vs. Dewey |
| 1948 | 5.5% | Truman vs. Dewey |
| 1952 | 18.4% | Eisenhower vs. Stevenson |
| 1956 | 6.6% | Eisenhower vs. Stevenson |
| 1960 | .50% | Kennedy vs. Nixon |
| 1964 | 16.5% | Johnson vs. Goldwater |
| 1968 | 11.1% | Nixon vs. Humphrey |
| 1972 | 19.0% | Nixon vs. McGovern |
| 1976 | 23.8% | Carter vs. Ford |
| 1980 | 32.4% | Reagan vs. Carter |
| 1984 | 6.3% | Reagan vs. Mondale |
| 1988 | 16.8% | Bush vs. Dukakis |
| 1992 | 7.6% | Clinton vs. Bush |
| 1996 | 23% | Clinton vs. Dole |
| 2000 | -9.1% | Bush vs. Gore |
| 2004 | 10.9% | Bush vs. Kerry |
| 2008 | -37% | Obama vs. McCain |
| 2012 | 7.8% and counting | Obama vs. Mitt Romney |
Majority of the investor were hoping of major sell off after negative JPM earning and China GDP slowed down to 7.6%, but once again market reacted in opposite direction to what majority thought. JPM rallied 6%, while Dow Jones was up 204 point, S&P500 22 point and Nasdaq 42 point. For the week, Dow was up 4 point, S&P500 was up 2.1 point and Nasdaq was down 29 point. since 4th June, Dow is up 732 point, and s&P500 is up 79 point.
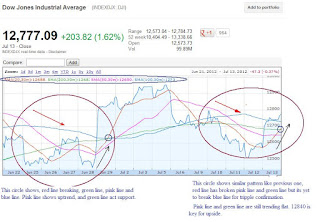
Below chart shows, 1 month, 3 year and 15 year chart of Dow Jones. Next week is very important, if Dow breaks 12,840 resistance, its going above 13k. 1 Month chart needs one more day of rally, to confirm the uptrend. Dow has been in 8000 - 12,000 range for past 15 year. 15 year chart shows, there is possibility of Dow going back to 8000-9000 level because the bull rally which started in 2009 needs correction which hasn't happened. There is no doubt fed will manipulate this market which they are doing even now, but they were present when flash crash happened and when market dropped 1000 point in 2008-2009,2010, 2011 and 2012.
 |
| Next week is very important if Dow break 12,840 resistance, then its going above 13000. Dow needs one more day of rally to confirm uptrend. |
 |
| Dow Jones 3 year chart there is downside in coming month. |
 |
| Dow Jones 15 year chart analysis, shows there will be Lehman like event if key resistance of 12,225 is broken |