Stock market is expected to open flat lower tomorrow. But its still not a downtrend. The channel is narrowing, as shown in the chart. Soon, market will move big whether up or down. But 13934 is the level to watch on downside while 14032 for the upside. It is side way market and very difficult to place a bet especially option. So avoid playing long put or call in this market. Watch HLF, NUS, MED, BTH, USNA for big squeeze. CPB, QLIK, DTLK, ELLI are other stock to watch.
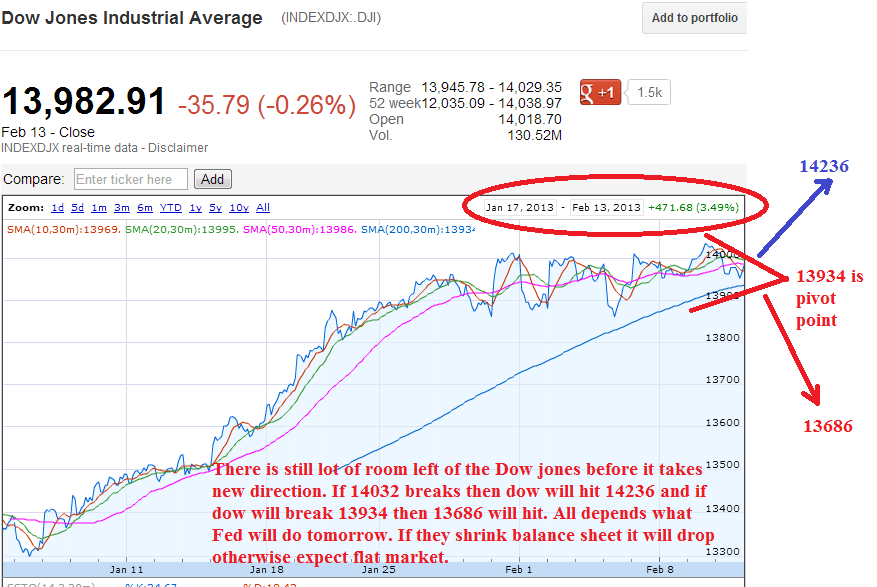 |
| Because there is no change to chart pattern, I am posting chart from yesterday. Market is expected to open flat lower |
 |
| Federal Reserve have printed enough to support S&P500 at 1530 level |
S&P500:
| R3 | 1,534.13 | Fib R3 | 1,528.54 | Brk Out Long | 1,526.40 |
| R2 | 1,528.63 | Fib R2 | 1,525.17 | Short | 1,523.89 |
| R1 | 1,525.01 | Fib R1 | 1,522.98 | HL2 | 1,523.05 |
| Pivot | 1,519.51 | Pivot | 1,519.51 | HL1 | 1,522.22 |
| S1 | 1,515.89 | Fib S1 | 1,516.05 | LL1 | 1,520.54 |
| S2 | 1,510.39 | Fib S2 | 1,513.86 | LL2 | 1,519.71 |
| S3 | 1,506.77 | Fib S3 | 1,510.48 | Long | 1,518.87 |
| Brk Out Short | 1,516.36 |
Dow Jones:
| R3 | 14,070.27 | Fib R3 | 14,029.63 | Brk Out Long | 14,011.02 |
| R2 | 14,030.32 | Fib R2 | 14,004.32 | Short | 13,992.21 |
| R1 | 14,001.85 | Fib R1 | 13,987.90 | HL2 | 13,985.93 |
| Pivot | 13,961.90 | Pivot | 13,961.90 | HL1 | 13,979.66 |
| S1 | 13,933.43 | Fib S1 | 13,935.90 | LL1 | 13,967.12 |
| S2 | 13,893.48 | Fib S2 | 13,919.48 | LL2 | 13,960.85 |
| S3 | 13,865.01 | Fib S3 | 13,894.16 | Long | 13,954.57 |
| Brk Out Short | 13,935.76 |
AAPL:
| R3 | 478.43 | Fib R3 | 474.96 | Brk Out Long | 470.78 |
| R2 | 475.04 | Fib R2 | 472.14 | Short | 468.69 |
| R1 | 470.81 | Fib R1 | 470.31 | HL2 | 467.99 |
| Pivot | 467.42 | Pivot | 467.42 | HL1 | 467.29 |
| S1 | 463.19 | Fib S1 | 464.52 | LL1 | 465.89 |
| S2 | 459.80 | Fib S2 | 462.69 | LL2 | 465.19 |
| S3 | 455.57 | Fib S3 | 459.87 | Long | 464.49 |
| Brk Out Short | 462.40 |
XIV:
| R3 | 23.76 | Fib R3 | 23.37 | Brk Out Long | 22.99 |
| R2 | 23.37 | Fib R2 | 23.07 | Short | 22.78 |
| R1 | 22.97 | Fib R1 | 22.88 | HL2 | 22.70 |
| Pivot | 22.58 | Pivot | 22.58 | HL1 | 22.63 |
| S1 | 22.18 | Fib S1 | 22.28 | LL1 | 22.49 |
| S2 | 21.79 | Fib S2 | 22.09 | LL2 | 22.42 |
| S3 | 21.39 | Fib S3 | 21.80 | Long | 22.34 |
| Brk Out Short | 22.13 |
VXX:
| R3 | 23.67 | Fib R3 | 23.27 | Brk Out Long | 22.92 |
| R2 | 23.28 | Fib R2 | 22.98 | Short | 22.71 |
| R1 | 22.88 | Fib R1 | 22.79 | HL2 | 22.63 |
| Pivot | 22.49 | Pivot | 22.49 | HL1 | 22.56 |
| S1 | 22.09 | Fib S1 | 22.19 | LL1 | 22.42 |
| S2 | 21.70 | Fib S2 | 22.00 | LL2 | 22.35 |
| S3 | 21.30 | Fib S3 | 21.70 | Long | 22.27 |
| Brk Out Short | 22.06 |
UVXY:
| R3 | 11.11 | Fib R3 | 10.74 | Brk Out Long | 10.46 |
| R2 | 10.74 | Fib R2 | 10.48 | Short | 10.26 |
| R1 | 10.41 | Fib R1 | 10.31 | HL2 | 10.20 |
| Pivot | 10.04 | Pivot | 10.04 | HL1 | 10.13 |
| S1 | 9.71 | Fib S1 | 9.78 | LL1 | 10.01 |
| S2 | 9.34 | Fib S2 | 9.61 | LL2 | 9.94 |
| S3 | 9.01 | Fib S3 | 9.35 | Long | 9.88 |
| Brk Out Short | 9.69 |
GLD:
| R3 | 160.93 | Fib R3 | 160.27 | Brk Out Long | 159.24 |
| R2 | 160.29 | Fib R2 | 159.68 | Short | 158.79 |
| R1 | 159.32 | Fib R1 | 159.29 | HL2 | 158.65 |
| Pivot | 158.68 | Pivot | 158.68 | HL1 | 158.50 |
| S1 | 157.71 | Fib S1 | 158.07 | LL1 | 158.20 |
| S2 | 157.07 | Fib S2 | 157.68 | LL2 | 158.05 |
| S3 | 156.10 | Fib S3 | 157.09 | Long | 157.91 |
| Brk Out Short | 157.46 |
SLV:
| R3 | 30.62 | Fib R3 | 30.29 | Brk Out Long | 29.87 |
| R2 | 30.30 | Fib R2 | 30.02 | Short | 29.66 |
| R1 | 29.88 | Fib R1 | 29.84 | HL2 | 29.60 |
| Pivot | 29.56 | Pivot | 29.56 | HL1 | 29.53 |
| S1 | 29.14 | Fib S1 | 29.28 | LL1 | 29.39 |
| S2 | 28.82 | Fib S2 | 29.10 | LL2 | 29.32 |
| S3 | 28.40 | Fib S3 | 28.83 | Long | 29.26 |
| Brk Out Short | 29.05 |
After hour gainer and loser:
| Percentage Gainers | |||||||||
| Issue | Symbol | Volume | Last | Chg | % Chg | High | Low | ||
| Herbalife | HLF | 1,081,687 | $45.25 | 6.98 | $45.26 | $37.61 | |||
| Qlik Technologies | QLIK | 871,123 | 26.13 | 3.37 | 30.57 | 21.81 | |||
| Datalink | DTLK | 32,045 | 10.25 | 0.98 | 10.60 | 8.88 | |||
| ELLIE MAE | ELLI | 162,256 | 23.00 | 2.12 | 23.50 | 20.85 | |||
| Fresh Market | TFM | 5,016 | 50.22 | 4.17 | 50.29 | 46.05 | |||
| Hospira | HSP | 67,811 | 32.70 | 2.65 | 32.70 | 30.03 | |||
| Nu Skin Enterprises Cl A | NUS | 12,140 | 44.00 | 2.07 | 44.30 | 41.70 | |||
| Wet Seal Cl A | WTSLA | 11,982 | 3.10 | 0.13 | 3.45 | 2.77 | |||
| Pilgrim's Pride | PPC | 10,284 | 9.50 | 0.39 | 9.50 | 8.45 | |||
| GT Advanced Technologies | GTAT | 175,842 | 3.90 | 0.15 | 3.90 | 3.19 | |||
| Calpine | CPN | 66,953 | 19.43 | 0.72 | 19.43 | 18.71 | |||
| Research in Motion | BBRY | 1,278,798 | 15.55 | 0.48 | 15.74 | 14.31 | |||
| Percentage Decliners | |||||||||
| Issue | Symbol | Volume | Last | Chg | % Chg | High | Low | ||
| LogMeIn | LOGM | 200,278 | $18.49 | -5.17 | -21.85 | $23.66 | $17.99 | ||
| Active Network | ACTV | 66,807 | 4.97 | -0.58 | -10.45 | 5.60 | 4.88 | ||
| Agilent Technologies | A | 486,577 | 41.00 | -3.58 | -8.03 | 44.58 | 40.50 | ||
| B&G Foods | BGS | 21,676 | 29.86 | -2.38 | -7.38 | 32.24 | 28.88 | ||
| On Assignment | ASGN | 22,136 | 23.20 | -1.46 | -5.92 | 24.74 | 23.00 | ||
| Key Energy Services | KEG | 18,445 | 8.50 | -0.32 | -3.63 | 8.90 | 8.50 | ||
| Big Lots | BIG | 25,210 | 33.55 | -1.21 | -3.49 | 34.76 | 33.55 | ||
| Medivation | MDVN | 23,668 | 51.52 | -1.83 | -3.43 | 54.74 | 51.52 | ||
| J.C. Penney | JCP | 74,606 | 19.35 | -0.59 | -2.96 | 20.04 | 19.25 | ||
Economic Calendar:
| Session | Time | Currency | Event | Impact | Actual | Forecast | Prev. | |||
|---|---|---|---|---|---|---|---|---|---|---|
| 3:00 | EUR | President of the European Council Van Rompuy speaks at European Parliament | low | |||||||
| 5:00 | EUR | Trade balance (nsa) | low | 13.7 | ||||||
| 8:30 | USD | Empire State Survey | med | -3 | -7.78 | |||||
| 9:00 | USD | Net Long-term TICS Flows | low | 52.3 | ||||||
| 9:15 | USD | Capacity utilisation | med | 78.9 | 78.8 | |||||
| 9:15 | USD | Industrial production | med | 0.2 | 0.3 | |||||
| 9:50 | USD | Fed's Pianalto speaks on economy and monetary policy in Florida | low | |||||||
| 9:55 | USD | Univ of Mich Sent. (Prelim.) | med | 74.5 | 73.8 | |||||
Enbridge Inc ( ENB ) is reporting for the quarter ending December 31, 2012. The oil (production/pipeline) company's consensus earnings per share forecast from the 6 analysts that follow the stock is $0.45. This value represents a 21.62% increase compared to the same quarter last year. Zacks Investment Research reports that the 2012 Price to Earnings ratio for ENB is 26.77 vs. an industry ratio of 17.80, implying that they will have a higher earnings growth than their competitors in the same industry.
Brookfield Asset Management Inc ( BAM ) is reporting for the quarter ending December 31, 2012. The finance/investment management company's consensus earnings per share forecast from the 2 analysts that follow the stock is $0.30. This value represents a -33.33% decrease compared to the same quarter last year. Zacks Investment Research reports that the 2012 Price to Earnings ratio for BAM is 28.26 vs. an industry ratio of 29.00.
American Electric Power Company, Inc. ( AEP ) is reporting for the quarter ending December 31, 2012. The electric power utilities company's consensus earnings per share forecast from the 10 analysts that follow the stock is $0.45. This value represents a 12.50% increase compared to the same quarter last year. In the past year AEP has met analyst expectations three times and beat the expectations the other quarter. Zacks Investment Research reports that the 2012 Price to Earnings ratio for AEP is 14.78 vs. an industry ratio of 8.40, implying that they will have a higher earnings growth than their competitors in the same industry.
Ventas, Inc. ( VTR ) is reporting for the quarter ending December 31, 2012. The reit company's consensus earnings per share forecast from the 12 analysts that follow the stock is $0.97. This value represents a 8.99% increase compared to the same quarter last year. In the past year VTR has met analyst expectations once and beat the expectations the other three quarters. Zacks Investment Research reports that the 2012 Price to Earnings ratio for VTR is 17.97 vs. an industry ratio of 15.80, implying that they will have a higher earnings growth than their competitors in the same industry.
Rogers Communication, Inc. ( RCI ) is reporting for the quarter ending December 31, 2012. The cable tv company's consensus earnings per share forecast from the 9 analysts that follow the stock is $0.73. This value represents a 4.29% increase compared to the same quarter last year. RCI missed the consensus earnings per share in the 2nd calendar quarter of 2012 by -3.53%. The "days to cover" for this stock exceeds 34 days. Zacks Investment Research reports that the 2012 Price to Earnings ratio for RCI is 14.31 vs. an industry ratio of 14.40.
V.F. Corporation ( VFC ) is reporting for the quarter ending December 31, 2012. The textile company's consensus earnings per share forecast from the 16 analysts that follow the stock is $3.03. This value represents a 30.60% increase compared to the same quarter last year. In the past year VFC has beat the expectations every quarter. The highest one was in the 3rd calendar quarter where they beat the consensus by 0.86%. Zacks Investment Research reports that the 2012 Price to Earnings ratio for VFC is 15.87 vs. an industry ratio of 15.70, implying that they will have a higher earnings growth than their competitors in the same industry.
Campbell Soup Company ( CPB ) is reporting for the quarter ending January 31, 2013. The food company's consensus earnings per share forecast from the 15 analysts that follow the stock is $0.66. This value represents a 3.13% increase compared to the same quarter last year. In the past year CPB has beat the expectations every quarter. The highest one was in the 4th calendar quarter where they beat the consensus by 3.53%. The "days to cover" for this stock exceeds 11 days. Zacks Investment Research reports that the 2013 Price to Earnings ratio for CPB is 14.97 vs. an industry ratio of 18.00.
J.M. Smucker Company ( SJM ) is reporting for the quarter ending January 31, 2013. The food company's consensus earnings per share forecast from the 15 analysts that follow the stock is $1.37. This value represents a 12.30% increase compared to the same quarter last year. SJM missed the consensus earnings per share in the 1st calendar quarter of 2012 by -13.48%. Zacks Investment Research reports that the 2013 Price to Earnings ratio for SJM is 17.34 vs. an industry ratio of 18.00.
Digital Realty Trust, Inc. ( DLR ) is reporting for the quarter ending December 31, 2012. The reit company's consensus earnings per share forecast from the 16 analysts that follow the stock is $1.16. This value represents a 13.73% increase compared to the same quarter last year. In the past year DLR has met analyst expectations once and beat the expectations the other three quarters. Zacks Investment Research reports that the 2012 Price to Earnings ratio for DLR is 14.79 vs. an industry ratio of 15.80.
TRW Automotive Holdings Corporation ( TRW ) is reporting for the quarter ending December 31, 2012. The auto (truck) company's consensus earnings per share forecast from the 8 analysts that follow the stock is $1.35. This value represents a -26.63% decrease compared to the same quarter last year. In the past year TRW has beat the expectations every quarter. The highest one was in the 3rd calendar quarter where they beat the consensus by 6.9%. Zacks Investment Research reports that the 2012 Price to Earnings ratio for TRW is 10.02 vs. an industry ratio of 10.80.
Lincoln Electric Holdings, Inc. ( LECO ) is reporting for the quarter ending December 31, 2012. The machinery company's consensus earnings per share forecast from the 8 analysts that follow the stock is $0.74. This value represents a 8.82% increase compared to the same quarter last year. LECO missed the consensus earnings per share in the 2nd calendar quarter of 2012 by -4.71%. Zacks Investment Research reports that the 2012 Price to Earnings ratio for LECO is 17.97 vs. an industry ratio of 14.20, implying that they will have a higher earnings growth than their competitors in the same industry.
Wabco Holdings Inc. ( WBC ) is reporting for the quarter ending December 31, 2012. The auto (truck) company's consensus earnings per share forecast from the 9 analysts that follow the stock is $0.95. This value represents a -21.49% decrease compared to the same quarter last year. WBC missed the consensus earnings per share in the 3rd calendar quarter of 2012 by -1.92%. Zacks Investment Research reports that the 2012 Price to Earnings ratio for WBC is 15.95 vs. an industry ratio of 10.80, implying that they will have a higher earnings growth than their competitors in the same industry.
No comments:
Post a Comment